
Agent Visualization#
Agent visualization allows you to generate a structured graphical representation of agents and their relationships using Graphviz. This is useful for understanding how agents, tools, and handoffs interact within an application.
Installation#
Install the optional viz dependency group:
pip install "openai-agents[viz]"
Generating a Graph#
You can generate an agent visualization using the draw_graph function. This function creates a directed graph where:
Agents are represented as yellow boxes.
Tools are represented as green ellipses.
Handoffs are directed edges from one agent to another.
Example Usage#
from agents import Agent, function_tool
from agents.extensions.visualization import draw_graph

@function_tool
def get_weather(city: str) -> str:
    return f"The weather in {city} is sunny."

spanish_agent = Agent(
    name="Spanish agent",
    instructions="You only speak Spanish.",
)

english_agent = Agent(
    name="English agent",
    instructions="You only speak English",
)

triage_agent = Agent(
    name="Triage agent",
    instructions="Handoff to the appropriate agent based on the language of the request.",
    handoffs=[spanish_agent, english_agent],
    tools=[get_weather],
)

draw_graph(triage_agent)
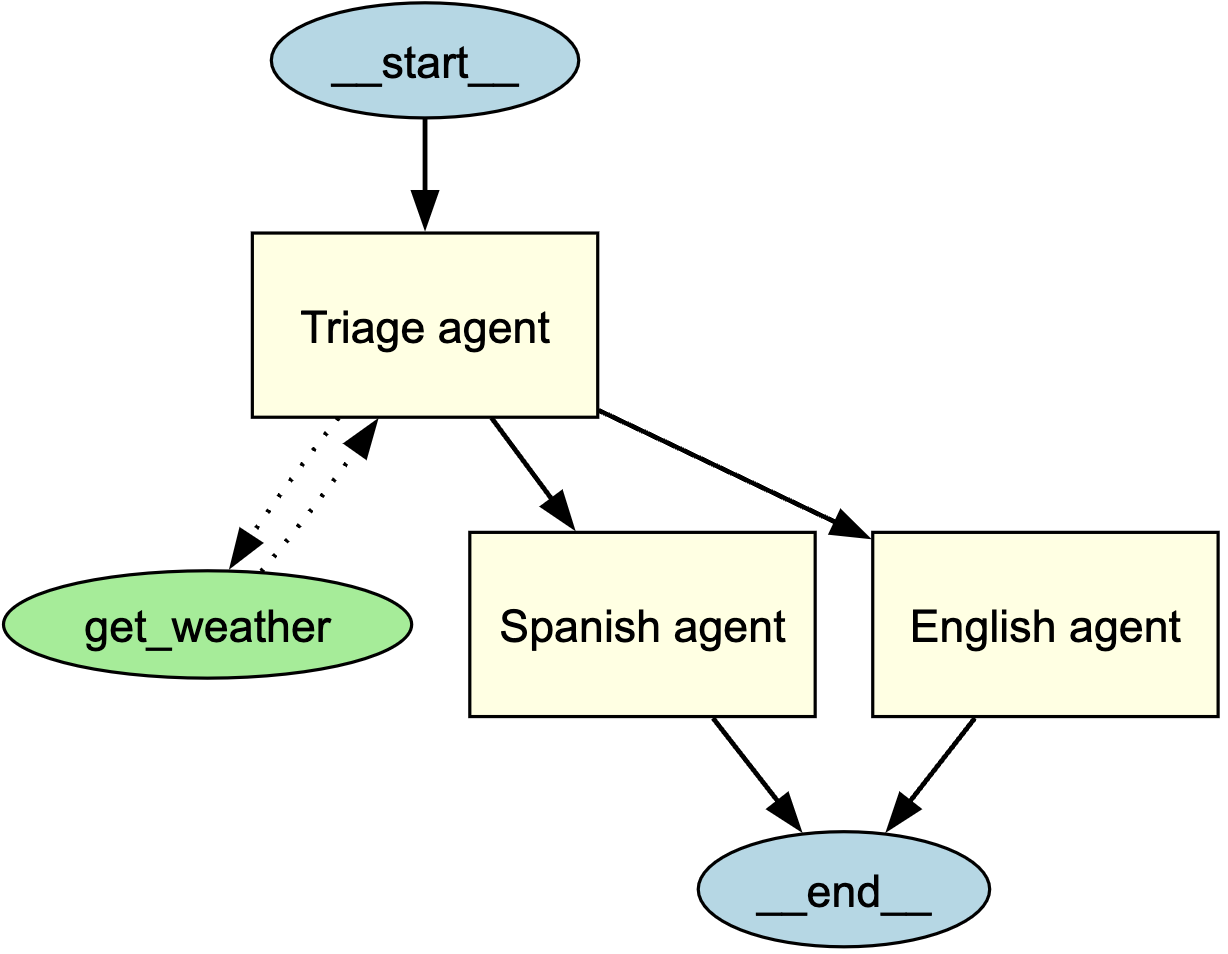
This generates a graph that visually represents the structure of the triage agent and its connections to sub-agents and tools.
Understanding the Visualization#
The generated graph includes:
A start node (
__start__) indicating the entry point.Agents represented as rectangles with yellow fill.
Tools represented as ellipses with green fill.
Directed edges indicating interactions:
Solid arrows for agent-to-agent handoffs.
Dotted arrows for tool invocations.
An end node (
__end__) indicating where execution terminates.
Customizing the Graph#
Showing the Graph#
By default, draw_graph displays the graph inline. To show the graph in a separate window, write the following:
draw_graph(triage_agent).view()
Saving the Graph#
By default, draw_graph displays the graph inline. To save it as a file, specify a filename:
draw_graph(triage_agent, filename="agent_graph")
This will generate agent_graph.png in the working directory.